Beyond MAGT: learning more from permafrost thermal monitoring data with additional metrics.

Ground temperature is the most common variable in permafrost monitoring and one of three products used to characterize the permafrost Essential Climate Variable by the World Meteorological Organization.

PermafrostNet’s data scientist, Nicholas Brown, has conducted an investigation into the metrics used to assess indicators of permafrost and heat changes in the ground.

Based on this investigation, recommendations are provided for a set of five metrics that offer a more comprehensive picture of permafrost thaw.

Metrics such as the mean annual ground temperature (MAGT) and active layer thickness (ALT) are used to monitor and quantify permafrost change. However, these have limitations including those arising from the effects of latent heat, which reduce their sensitivity.

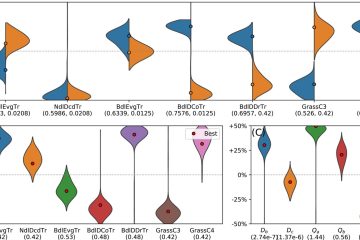
The team investigated the behaviour of existing and novel metrics derived from temperature observations (TSP metrics) using an ensemble of more than seventy 120-year simulations. They evaluated which TSP metrics provide new insight into permafrost change and evaluated how reliably each one indicates changes in sensible, latent, and total heat contents for different levels of sensor quality. They also quantified the effect of sensor placement on the magnitude of observed MAGT trends.

Brown, N. and Gruber, S. (2025). Beyond MAGT: learning more from permafrost thermal monitoring data with additional metrics, EGUSphere [preprint], DOI: https://doi.org/10.5194/egusphere-2025-2658

Modelling the temporal dynamics of subarctic surface temperature inversions from atmospheric reanalysis for producing point-scale multi-decade meteorological time series in mountains

The vertical profile of air temperatures in subarctic regions is difficult to quantify, especially in areas with mountainous terrain subject to strong and lasting inversion events. 

Relying on observational data is not possible in most places due to sparse weather stations.

Une étude récente de Victor Pozsgay tackles the challenge of developing a model that leverages atmospheric reanalysis data and calibrates it using data from five weather stations in the Yukon, Canada.

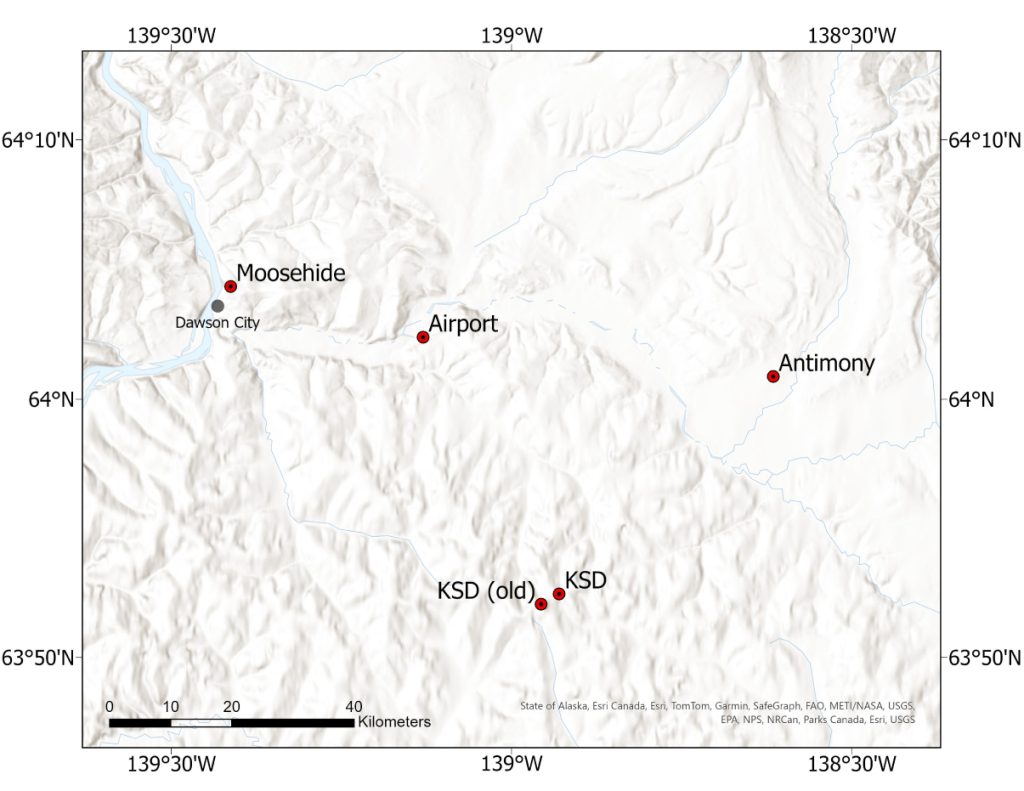
Map of the study area showing the five sites around Dawson City, Yukon Territory, Canada. The basemap is composed of the Esri World Terrain Base and Esri World Hillshade layers, and is projected in the WGS 1984 Web Mercator projection.

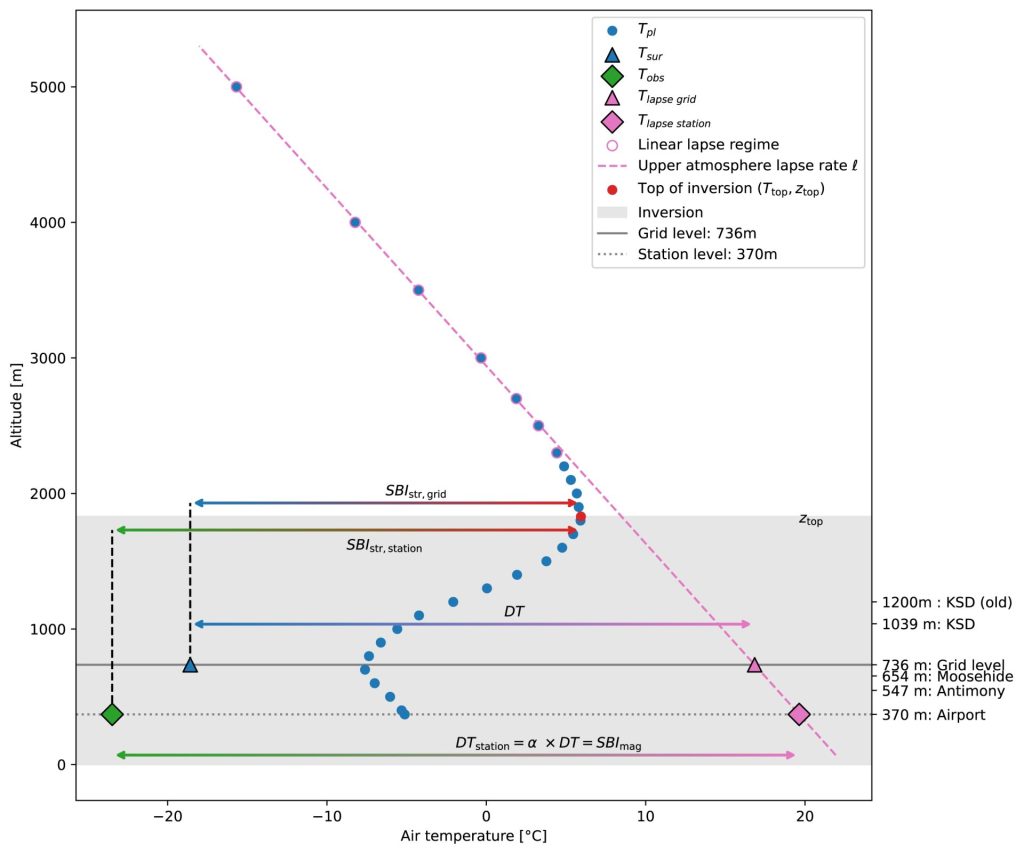
Accurately tracking air temperatures in subarctic mountainous regions is a challenging task, especially due to the prevalence of strong and frequent temperature inversions. These inversions play a critical role in shaping permafrost distribution and regional climate dynamics, yet traditional observations are sparse because of the lack of weather stations in rugged terrain. Victor’s study tackles this challenge by developing a model that leverages atmospheric reanalysis data and calibrates it using actual data from the Yukon. The calibrated model successfully reflects the trends in inversion frequency, strength, and depth that have been evolving since 1948, departing from typical warming patterns seen elsewhere. This approach makes it possible to produce reliable, point-scale meteorological time series for even the most inaccessible locations—an essential advance for studies of permafrost and the broader climate system. The model’s reliance on global reanalysis data and minimal location-specific calibration means it is poised to be both future-proof and widely applicable for regional climate applications, offering a much-needed solution for addressing data gaps in complex, mountainous terrains.

Mean daily pressure-level temperatures for several altitudes at and above the Dawson Airport (ERA5 data on 1 February 2007). The dependence with altitude is linear above 2300 m, where the linear lapse rate can be fitted. Below this, a ‘‘lapse’’ temperature is extrapolated at the grid and station levels. In the grey band, the altitudinal temperature behaviour is inverted, increasing with elevation. The elevation of the five stations used is reported on the right-hand side. The reanalysis data appear in blue, with points representing the pressure level air temperature Tpl and a triangle at the grid level for the surface temperature Tsur. Finally, the observed temperature Tobs is a green diamond at the station’s elevation.

Victor Pozsgay and Stephan Gruber. 2025. Modelling the temporal dynamics of subarctic surface temperature inversions from atmospheric reanalysis for producing point-scale multi-decade meteorological time series in mountains. Arctic Science11: 1-16. https://doi.org/10.1139/as-2025-0027

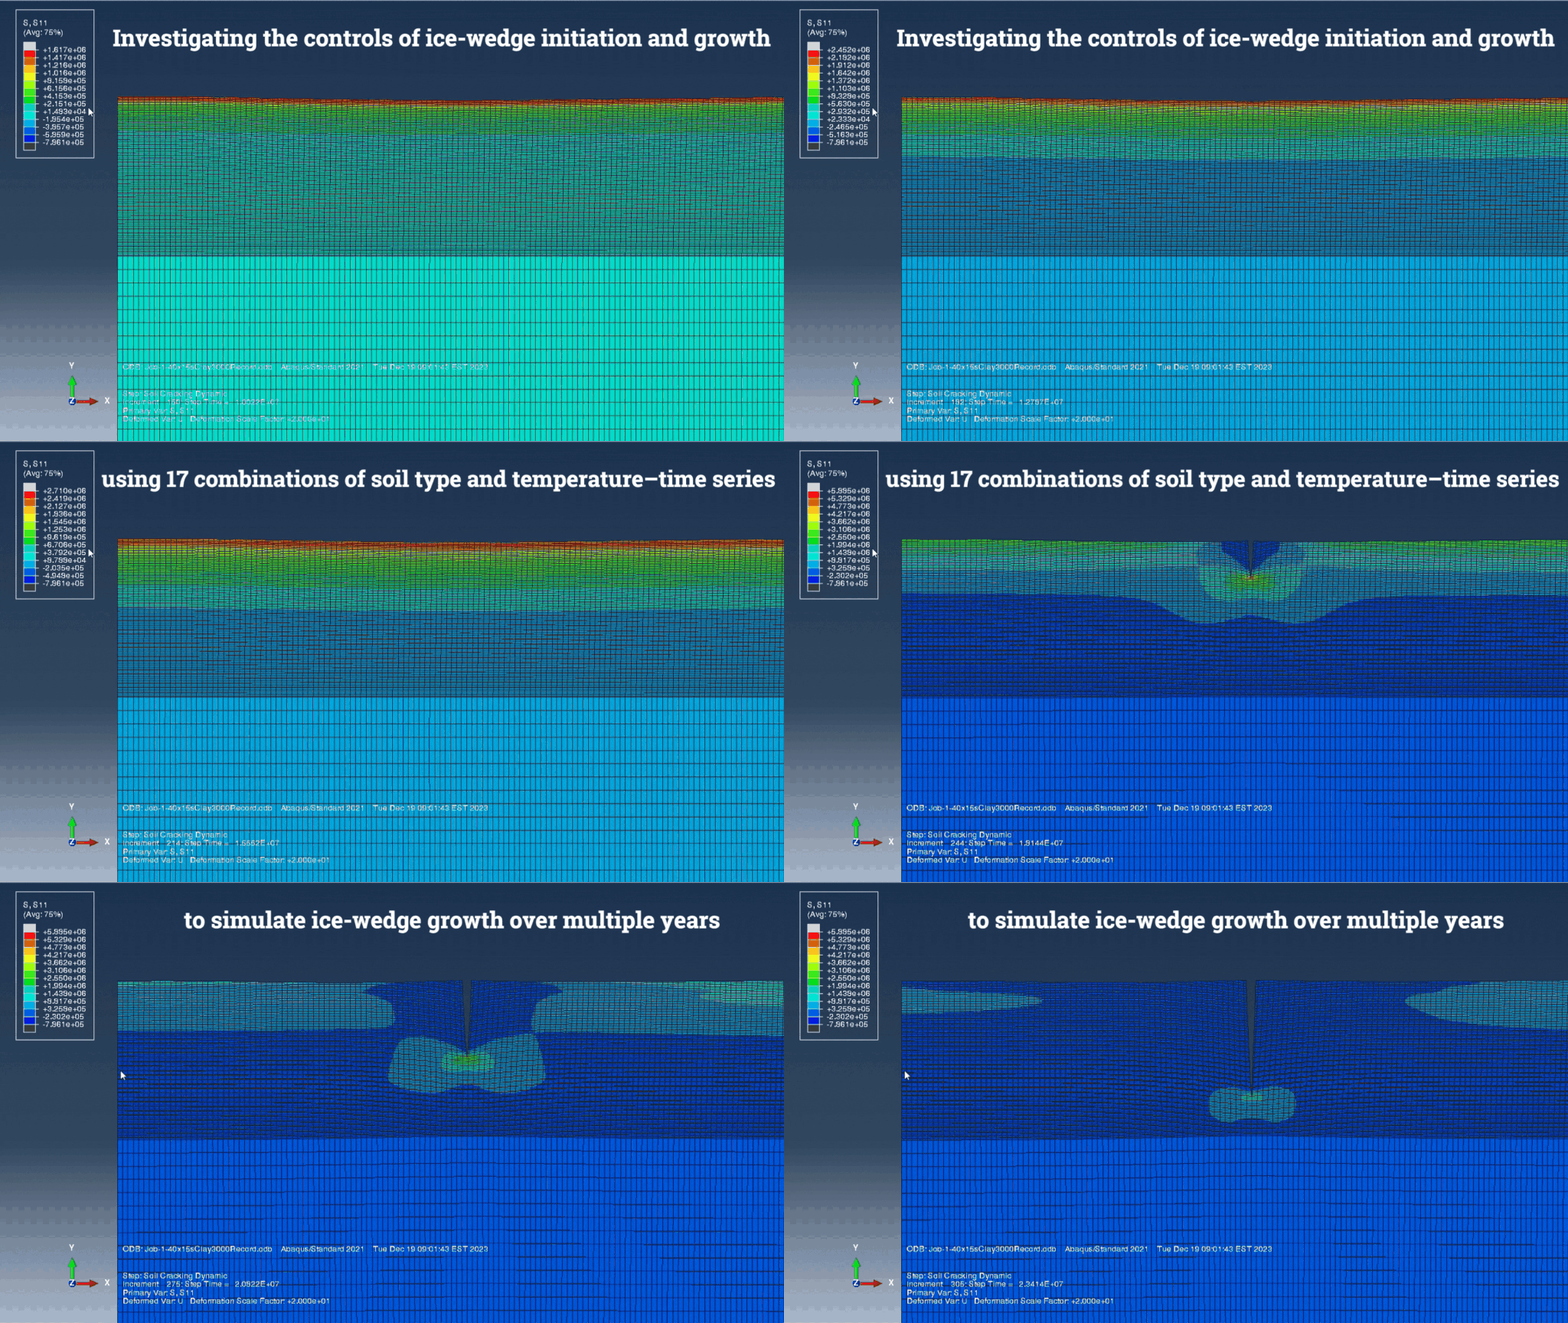
Investigating the controls of ice-wedge initiation and growth using XFEM

A study of how climate, soil type and water saturation affect ice-wedge cracks

A new study by Gabriel Karam et al asks, how do climate and soil control the ice-wedge formation process?

Answering these questions can further our understanding of wedge-ice volume and distribution.

Ice wedge cracking simulation gif

Ice-wedges are periglacial landforms that develop as a result of thermal contraction-cracking in continuous permafrost regions, which appear as polygonal networks on the ground surface. Given their complex thermo- mechanical loading history, very few related numerical models have so far been developed. This study developed a new climate-driven model to show the fractures in soil that develop from thermal contraction in winter. The range of model results indicate how climate, soil type and water saturation of the soil affect the spacing, depth, and width of ice-wedge cracks. Estimating ice-wedge depth can help us make informed volume calculations which are otherwise difficult to measure in the field.

Karam, G., Pouragha, M. and Gruber, S. (2024). Investigating the controls of ice-wedge initiation and growth using XFEM, Computers and Geotechnics, Volume 173, DOI: 10.1016/j.compgeo.2024.106549

A typical simulation result showing multiple cracks.

A prototype field-to-publication data system for a multi-variable permafrost observation network.

A prototype field-to-publication data system for a multi-variable permafrost observation network.
Blog post by Nick Brown, NSERC PermafrostNet Data Scientist

Analysis and prediction of permafrost change are hampered by lack of observational data. In collaboration with Stephan Gruber, Peter Pulsifer, and Amos Hayes, we developed a permafrost data management system to support permafrost observation networks that involve many different kinds of permafrost data.

We identify five broad challenges for permafrost data management and publication: (1) existing data management strategies do not scale well, (2) data users have different skills and needs, (3) permafrost data are varied, (4) resources for permafrost data management are limited, and (5) existing permafrost data sources are difficult to integrate. Our prototype system supports a permafrost data workflow from observation to the distribution of interoperable data. The system simplifies data publication and management, although we identify and discuss several hurdles in adapting the CF conventions and ERDDAP for permafrost data. Our learning can inform organizations who collect, manage, or distribute permafrost data or those who manage large observation networks.

In summary:

  • Five broad challenges limit permafrost data management and publication.
  • We frame these challenges as requirements, and identify similarities with the FAIR principles.
  • We developed a prototype a permafrost data system to support field-to-publication workflows.
  • In this project, we use an “adopt and adapt” approach for standards and software.
  • Our data system supports more FAIR permafrost data.

Nicholas Brown, Stephan Gruber, Peter Pulsifer, Amos Hayes, A prototype field-to-publication data system for a multi-variable permafrost observation network, Environmental Modelling & Software, Volume 175, 2024, 106006, ISSN 1364-8152, doi:10.1016/j.envsoft.2024.106006

This research was enabled in part by support provided by Compute Ontario et du Digital Research Alliance of Canada.

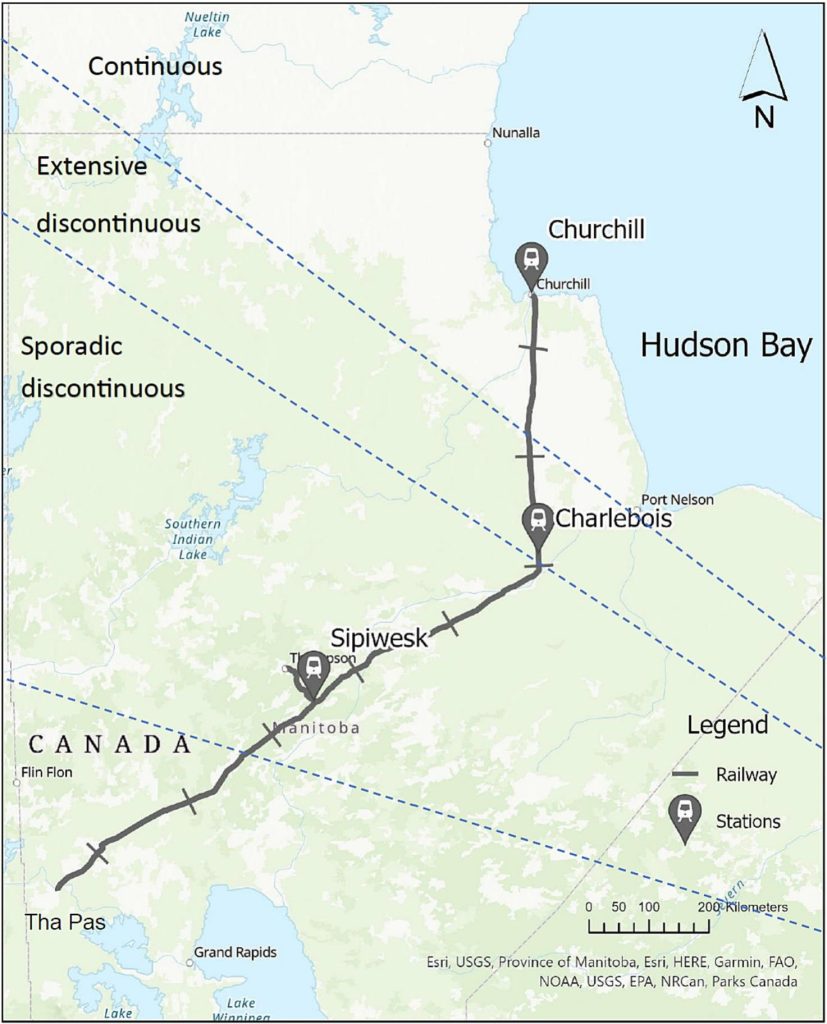
The study area showing the Hudson Bay Railway extending from Churchill to The Pas, Manitoba.

A study of thermal modeling parameters and their impact on modelled permafrost responses to climate warming

A study of thermal modeling parameters and their impact on modelled permafrost responses to climate warming

Une étude par Khatereh Roghangar et Jocelyn Hayley a évalué les effets des paramètres de modélisation thermique sur la réponse du pergélisol au réchauffement climatique. Ils ont analysé comment les variations de profondeur, de teneur en eau et de type de sol affectent les prévisions des profondeurs futures des couches actives et du tassement selon divers scénarios climatiques en utilisant les caractéristiques du sol le long du corridor ferroviaire de la baie d'Hudson.

Les résultats indiquent que, pour les sols à grains fins, la profondeur du modèle est un paramètre plus significatif que pour les sols à grains grossiers. La teneur en eau de tous les types de sol est un facteur essentiel pour déterminer le moment auquel le pergélisol dégèle et la profondeur à laquelle se situe la couche active, car une teneur en eau plus élevée entraîne des changements plus importants dans la couche active et un tassement plus important dans la plupart des cas. Ces découvertes ont des implications importantes pour la gestion des infrastructures et de l’utilisation des terres dans la région arctique.

Roghangar, K. and Hayley, J.L. (2024). A study of thermal modeling parameters and their impact on modelled permafrost responses to climate warmingCold Regions Science and Technology, 221, 104155, DOI: 10.1016/j.coldregions.2024.104155.

The study area showing the Hudson Bay Railway extending from Churchill to The Pas, Manitoba.
Zone d'étude montrant le chemin de fer de la Baie d'Hudson s'étendant de Churchill à The Pas, au Manitoba.

Report on the 2023 NSERC PermafrostNet AGM

We hosted our fifth network Annual General Meeting (AGM) in Victoria, BC. The meeting was both in-person and virtual with keynote presentations on individual research projects, poster presentations, as well as updates on theme progress and synthesis products from the theme leaders.

The live-streamed presentation recordings can be viewed on our website and the posters, and pdfs of presentations, are available on the website here.

You can download and read the public meeting report here, while members can access the full network report in our members area.

Core in the core boat on the MSCL track.

Non-destructive multi-sensor core logging allows for rapid imaging and estimation of frozen bulk density and volumetric ice content in permafrost cores.

Non-destructive multi-sensor core logging allows for rapid imaging and estimation of frozen bulk density and volumetric ice content in permafrost cores

Des recherches passionnantes dans le laboratoire scientifique Permafrost ArChivesPACS Labde l'Université de l'Alberta a démontré une nouvelle application de la diagraphie multicapteurs pour l'analyse des carottes de pergélisol.

Les mesures des propriétés physiques principales sont généralement destructrices et prennent beaucoup de temps.

L’enregistrement multicapteurs non destructif (non-destructive multi-sensor core logging ou MSCL) peut analyser efficacement des échantillons de pergélisol et fournir des informations à haute résolution sans ces problèmes. Cette nouvelle technique permet une imagerie rapide, une mesure de la densité apparente et une estimation de la teneur en glace des carottes de pergélisol. L'équipe a pu visualiser des cryostructures et estimer la densité apparente gelée, la susceptibilité magnétique et la teneur volumétrique en glace.

La nouvelle technique est décrite dans l'article publié dans la revue The Cryosphere by Duane Froese’s lab: Pumple, J., Monteath, A., Harvey, J., Roustaei, M., Alvarez, A., Buchanan, C., and Froese, D.: Non-destructive multi-sensor core logging allows for rapid imaging and estimation of frozen bulk density and volumetric ice content in permafrost cores, The Cryosphere, 18, 489–503, https://doi.org/10.5194/tc-18-489-2024, 2024.

Core in the core boat on the MSCL track.
Cœur dans le support de cœur (« core boat ») sur le rail de MSCL.

Yukon Territory and western Northwest Territories, including Mackenzie Mountains and adjacent Mackenzie River Valley, with locations of all weather stations.

Performance of climate projections for Yukon and adjacent Northwest Territories.

Performance of climate projections for Yukon and adjacent Northwest Territories.

La conception des infrastructures sur le pergélisol doit tenir compte des impacts du changement climatique sur la stabilité du sol. Alors que des lignes directrices comme la CSA PLUS 4011:19 fournissent un cadre, le choix de scénarios climatiques appropriés reste un défi.

L'étude par Astrid Schetselaar, Trevor Anderson et Chris Burn révèle que le réchauffement observé au Yukon et dans les Territoires du Nord-Ouest (1991 à 2020) correspond aux projections climatiques extrêmes réalisées en 2003 pour le projet gazier Mackenzie.

Points clés à retenir pour les développeurs :

  • Envisagez d’adopter des scénarios de changement climatique plus agressifs lors de la conception des fondations du pergélisol, car ces projections sont plus précises.
  • Le pergélisol proche de la surface dans les parties méridionales de la région pourrait devenir insoutenable. Des études approfondies du site pour détecter les sols stables au dégel sont cruciales.
  • La hausse des températures hivernales signifie que l'efficacité opérationnelle des thermosiphons, utilisés pour refroidir les fondations, pourrait être entravée. Sur les sites où la préservation du sol gelé est essentielle à l’intégrité des infrastructures, le nombre de thermosiphons requis peut devoir augmenter.

Schetselaar, A.B., Andersen, T.S., and Burn, C.R. 2023. Performance of climate projections for Yukon and adjacent Northwest Territories, 1991-2020. Arctic, 76(3). doi: 10.14430/arctic77263

Yukon Territory and western Northwest Territories, including Mackenzie Mountains and adjacent Mackenzie River Valley, with locations of all weather stations.
Territoire du Yukon et ouest des Territoires du Nord-Ouest, y compris les monts Mackenzie et la vallée adjacente du fleuve Mackenzie, avec l'emplacement de toutes les stations météorologiques.

Comparison of mountain areas with permafrost in western Canada (coloured) and European areas (grey) for mean annual air temperature and total annual precipitation at a resolution of 30 km x 30 km.

Transfert des connaissances sur la cryosphère entre les montagnes au niveau mondial : Une étude de cas des montagnes de l’Ouest canadien, des Alpes européennes et des Scandes

Transfert des connaissances sur la cryosphère entre les montagnes au niveau mondial : Une étude de cas des montagnes de l’Ouest canadien, des Alpes européennes et des Scandes

La plupart des recherches sur le pergélisol de montagne se sont concentrées sur la petite zone des Alpes européennes. Cela nous amène à la question suivante : pouvez-vous transférer les connaissances sur la cryosphère des Scandes et des Alpes au Canada?

Emilie Stewart-Jonesa développé une méthode permettant de comparer les climats régionaux à une échelle grossière afin de mettre en évidence les similarités et les différences. Son articleTransfert des connaissances sur la cryosphère entre les montagnes au niveau mondial : Une étude de cas des montagnes de l’Ouest canadien, des Alpes européennes et des Scandespublié dans le Journal of Alpine Research en novembre peut désormais répondre à la question de savoir si nous pouvons transférer nos connaissances sur le pergélisol d'une région à une autre.

Comparison of mountain areas with permafrost in western Canada (coloured) and European areas (grey) for mean annual air temperature and total annual precipitation at a resolution of 30 km x 30 km.
Comparaison des zones montagneuses avec pergélisol dans l'ouest du Canada (en couleur) et dans les régions européennes (en gris) pour la température annuelle moyenne de l'air et les précipitations annuelles totales à une résolution de 30 km x 30 km.