The vertical profile of air temperatures in subarctic regions is difficult to quantify, especially in areas with mountainous terrain subject to strong and lasting inversion events.
Relying on observational data is not possible in most places due to sparse weather stations.
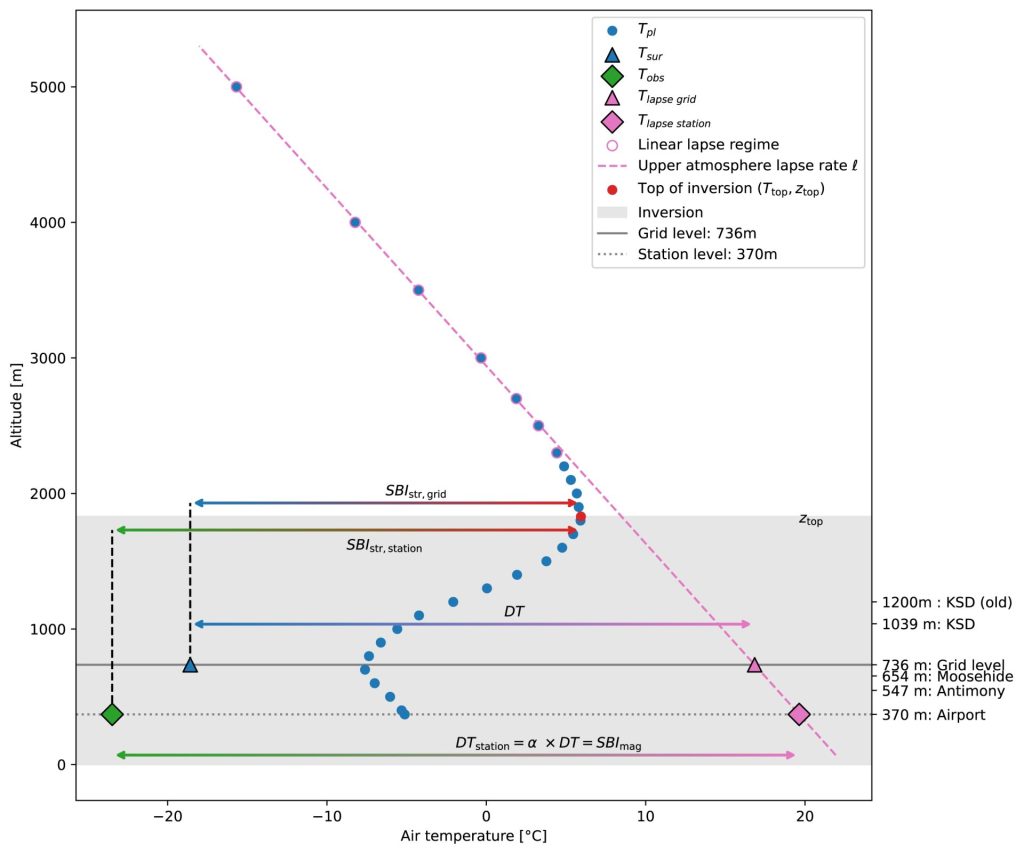
Une étude récente de Victor Pozsgay tackles the challenge of developing a model that leverages atmospheric reanalysis data and calibrates it using data from five weather stations in the Yukon, Canada.
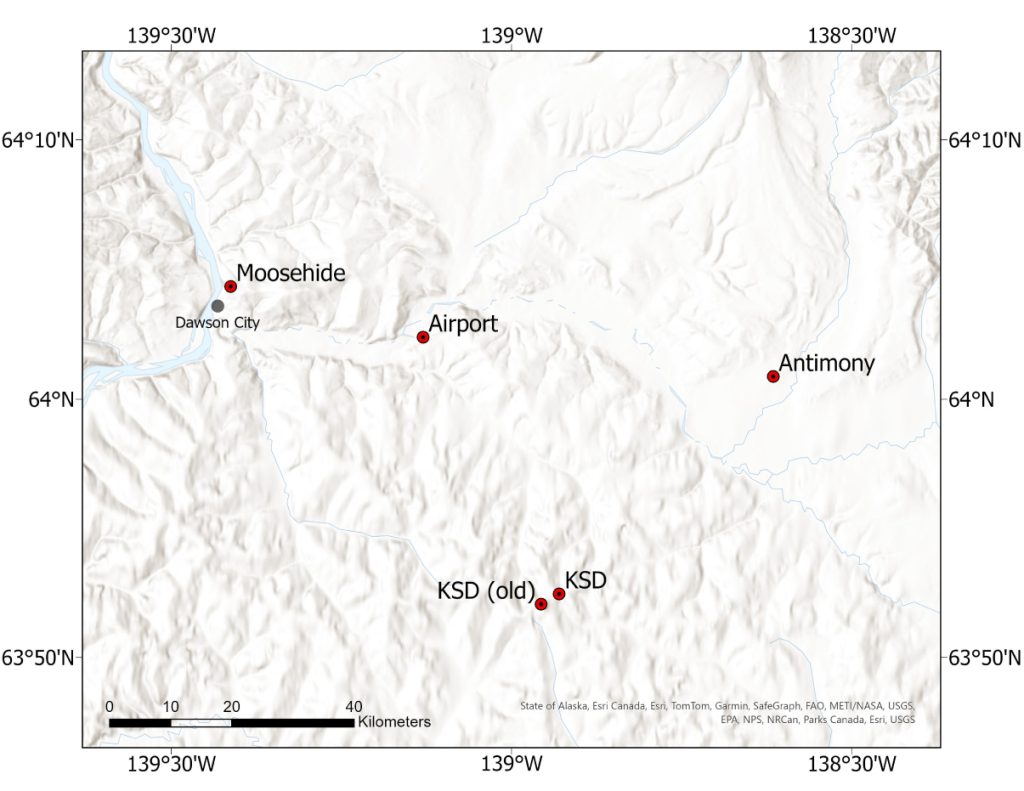
Accurately tracking air temperatures in subarctic mountainous regions is a challenging task, especially due to the prevalence of strong and frequent temperature inversions. These inversions play a critical role in shaping permafrost distribution and regional climate dynamics, yet traditional observations are sparse because of the lack of weather stations in rugged terrain. Victor’s study tackles this challenge by developing a model that leverages atmospheric reanalysis data and calibrates it using actual data from the Yukon. The calibrated model successfully reflects the trends in inversion frequency, strength, and depth that have been evolving since 1948, departing from typical warming patterns seen elsewhere. This approach makes it possible to produce reliable, point-scale meteorological time series for even the most inaccessible locations—an essential advance for studies of permafrost and the broader climate system. The model’s reliance on global reanalysis data and minimal location-specific calibration means it is poised to be both future-proof and widely applicable for regional climate applications, offering a much-needed solution for addressing data gaps in complex, mountainous terrains.
Victor Pozsgay and Stephan Gruber. 2025. Modelling the temporal dynamics of subarctic surface temperature inversions from atmospheric reanalysis for producing point-scale multi-decade meteorological time series in mountains. Arctic Science. 11: 1-16. https://doi.org/10.1139/as-2025-0027


0 Comments